

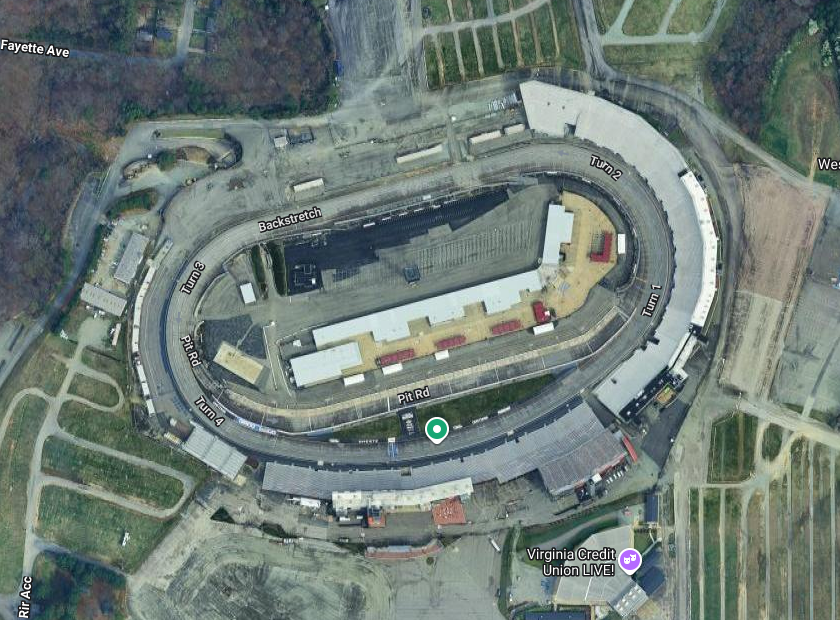
Flat, and technical. In our system Richmond carries two tags. The format is Flat: a low-speed, low-banking oval where the driver matters more than the car. The skill tag is Technical Oval: the bucket for tracks where precision and tire management beat raw pace. Both classifications carry weight in the projection model, so who has been good on these track types this season is not trivia. It is an input.
 Hamlin6.3
 Gibbs8.7
 Blaney9.1Blaney6.5Hamlin7.0Gibbs8.0
Denny Hamlin tops the Flat list the week our sim makes him the favorite, Ryan Blaney tops the Technical list, and Ty Gibbs is the only other driver in the top three of both. Track-type form is one of the signals inside Thursday's projections; the full track profiles live in the research library.
The last repave, 21 years ago. Goodyear calls Richmond one of the highest-wear tracks on the circuit. Tires fall off hard here, and managing them is the whole game.
Aero barely matters here. Aerodynamic force scales with speed squared, and short tracks are NASCAR's slowest ovals. Richmond is a driver-and-tires racetrack.
Only 13 of 40 dominators won. Races since 2005 won by the driver who led the most laps. The final pit cycle decides more than the fastest car.
The pole hasn't won here since 2016. Six of the last 12 winners started outside the top 10.
Every race week we send one email: full projections for every race on the schedule, and where our numbers disagree with the salaries. Free, every Thursday.
Get the Thursday email17 different winners in 40 races. Wins since 2005. One name clears the pack.
Hamlin5Denny Hamlin has led 2,367 laps here. That is 55% more than anyone else since 2005. Denny Hamlin is also a Virginia native: Richmond is his home track.
Hamlin2,367 Keselowski1,282
Kyle Busch won here from 32nd. 2018. The deepest winning drive since 2005, and Kyle Busch swept both Richmond races that year.
Dillon has won two straight here. Austin Dillon has back-to-back Cook Out 400 wins, 2024 and 2025. Two wins in 22 career Richmond starts, with a 15.2 average finish.
No champion has won here since 2008. The last title-year winner at Richmond was Jimmie Johnson.
Best average finish in the field: 8.2. Denny Hamlin over 37 starts. Christopher Bell (8.7) and Josh Berry (8.8) are the only others under 9.
Hamlin8.2 Bell8.7
 Berry8.8
The entered field
| Driver | Starts | Wins | Top 10 | Avg | Laps led |
|---|---|---|---|---|---|
| Denny Hamlin | 37 | 5 | 25 | 8.2 | 2,367 |
| Christopher Bell | 10 | – | 7 | 8.7 | 230 |
| Josh Berry | 4 | – | 2 | 8.8 | 12 |
 Joey Logano Joey Logano | 32 | 2 | 20 | 9.8 | 653 |
 Kyle Larson Kyle Larson | 21 | 2 | 11 | 10.4 | 355 |
| Brad Keselowski | 31 | 2 | 16 | 12.0 | 1,282 |
 Chase Elliott Chase Elliott | 18 | – | 8 | 12.2 | 105 |
 Shane van Gisbergen Shane van Gisbergen | 1 | – | – | 14.0 | – |
 William Byron William Byron | 14 | – | 3 | 14.8 | 239 |
 Austin Dillon Austin Dillon | 22 | 2 | 8 | 15.2 | 198 |
 Chase Briscoe Chase Briscoe | 9 | – | – | 16.3 | – |
 Daniel Suarez Daniel Suarez | 16 | – | 5 | 16.6 | 94 |
 Carson Hocevar Carson Hocevar | 3 | – | 1 | 16.7 | 12 |
 Tyler Reddick Tyler Reddick | 10 | – | 2 | 16.8 | 130 |
 Alex Bowman Alex Bowman | 18 | 1 | 5 | 18.2 | 19 |
| Ty Gibbs | 6 | – | 1 | 19.3 | – |
 Ross Chastain Ross Chastain | 13 | – | 3 | 19.4 | 100 |
 Austin Cindric Austin Cindric | 8 | – | 1 | 20.8 | 2 |
 Bubba Wallace Bubba Wallace | 14 | – | 1 | 20.9 | 206 |
 Ricky Stenhouse Jr. Ricky Stenhouse Jr. | 24 | – | 2 | 21.7 | 8 |
| Ryan Blaney | 35 | – | 5 | 21.9 | 172 |
 Chris Buescher Chris Buescher | 18 | 1 | 3 | 21.9 | 88 |
 Todd Gilliland Todd Gilliland | 7 | – | – | 22.1 | – |
 A.J. Allmendinger A.J. Allmendinger | 27 | – | 3 | 22.3 | 1 |
 Cole Custer Cole Custer | 7 | – | – | 22.4 | 2 |
 Erik Jones Erik Jones | 16 | – | 1 | 22.7 | – |
 Zane Smith Zane Smith | 3 | – | – | 23.0 | – |
 Ryan Preece Ryan Preece | 10 | – | 1 | 23.5 | 60 |
 Noah Gragson Noah Gragson | 6 | – | – | 24.7 | – |
 Ty Dillon Ty Dillon | 14 | – | – | 25.2 | – |
 Michael McDowell Michael McDowell | 28 | – | 1 | 29.0 | 16 |
 John Hunter Nemechek John Hunter Nemechek | 4 | – | – | 30.5 | – |
 Riley Herbst Riley Herbst | 2 | – | – | 32.0 | – |
 Cody Ware Cody Ware | 5 | – | – | 34.4 | – |
 Josh Bilicki Josh Bilicki | 2 | – | – | 36.5 | – |
Every Richmond Cup winner since 2005
| Race | Winner | Started | Led |
|---|---|---|---|
| May 2005 | Kasey Kahne | 1 | 242 |
| Sep 2005 | Kurt Busch | 5 | 185 |
| May 2006 | Dale Earnhardt Jr. | 10 | 47 |
| Sep 2006 | Kevin Harvick | 5 | 54 |
| May 2007 | Jimmie Johnson | 4 | 105 |
| Sep 2007 | Jimmie Johnson | 1 | 104 |
| May 2008 | Clint Bowyer | 31 | 13 |
| Sep 2008 | Jimmie Johnson | 3 | 32 |
| May 2009 | Kyle Busch | 14 | 53 |
| Sep 2009 | Denny Hamlin | 3 | 299 |
| May 2010 | Kyle Busch | 1 | 226 |
| Sep 2010 | Denny Hamlin | 14 | 251 |
| Apr 2011 | Kyle Busch | 20 | 235 |
| Sep 2011 | Kevin Harvick | 7 | 202 |
| Apr 2012 | Kyle Busch | 5 | 32 |
| Sep 2012 | Clint Bowyer | 4 | 88 |
| Apr 2013 | Kevin Harvick | 17 | 3 |
| Sep 2013 | Carl Edwards | 26 | 46 |
| Apr 2014 | Joey Logano | 17 | 46 |
| Sep 2014 | Brad Keselowski | 1 | 383 |
| Race | Winner | Started | Led |
|---|---|---|---|
| Apr 2015 | Kurt Busch | 3 | 291 |
| Sep 2015 | Matt Kenseth | 2 | 352 |
| Apr 2016 | Carl Edwards | 4 | 151 |
| Sep 2016 | Denny Hamlin | 1 | 189 |
| Apr 2017 | Joey Logano | 5 | 25 |
| Sep 2017 | Kyle Larson | 4 | 53 |
| Apr 2018 | Kyle Busch | 32 | 32 |
| Sep 2018 | Kyle Busch | 11 | 92 |
| Apr 2019 | Martin Truex Jr. | 5 | 186 |
| Sep 2019 | Martin Truex Jr. | 8 | 109 |
| Sep 2020 | Brad Keselowski | 9 | 192 |
| Apr 2021 | Alex Bowman | 24 | 10 |
| Sep 2021 | Martin Truex Jr. | 3 | 80 |
| Apr 2022 | Denny Hamlin | 13 | 5 |
| Aug 2022 | Kevin Harvick | 13 | 55 |
| Apr 2023 | Kyle Larson | 9 | 93 |
| Jul 2023 | Chris Buescher | 26 | 88 |
| Mar 2024 | Denny Hamlin | 11 | 17 |
| Aug 2024 | Austin Dillon | 6 | 35 |
| Aug 2025 | Austin Dillon | 11 | 107 |
Full Richmond projections, re-simmed through practice, qualifying, and driver news. The dynamic projections page is $5 a month; Pro opens the whole site.
See the projectionsPlans, from $5 a month